Cumulative Trends in Austin’s Real Estate Market: January–April New Listings and Pending Sales (2000–2025)
Austin’s real estate market is a dynamic hub for buyers, sellers, and investors, shaped by economic growth and shifting demand. By analyzing cumulative data for new listings, pending sales, and their differences from January through April each year from 2000 to 2025, we can track market cycles and identify opportunities. This data, specific to Austin, reflects the balance of housing supply and demand during the first four months annually. An image below the article visually represents these trends, highlighting key shifts in the market.
Market Cycles: Early 2000s Supply Surge
From 2000 to 2009, Austin’s January–April market was largely supply-driven. In 2000, 8,465 new listings slightly trailed 8,574 pending sales, yielding a difference of -109. By 2001, new listings jumped to 11,813 against 8,127 pending sales, creating a difference of 3,686. This trend peaked in 2003 with 14,424 new listings and 7,882 pending sales, resulting in a difference of 6,542, and continued in 2004 with 15,399 new listings and 9,653 pending sales, producing a difference of 5,746. The mid-2000s saw a brief balance, with 2006 recording 14,947 new listings and 14,464 pending sales (difference of 483) and 2007 showing 14,793 new listings and 14,656 pending sales (difference of 137). By 2008 and 2009, supply rose again, with differences of 3,700 (15,930 new listings, 12,230 pending sales) and 3,772 (13,088 new listings, 9,316 pending sales).
Market Cycles: 2010s to Early 2020s Demand Surge
From 2010 to 2023, demand dominated Austin’s January–April market. In 2010, 16,077 new listings outpaced 12,619 pending sales, yielding a difference of 3,458, but by 2012, pending sales (12,905) surpassed new listings (12,453), resulting in a difference of -452. This demand-driven trend intensified, with 2013 showing 12,845 new listings and 15,488 pending sales (difference of -2,643), 2015 recording 13,152 new listings and 16,007 pending sales (difference of -2,855), and 2021 marking the peak negative difference of -4,546 (14,356 new listings, 18,902 pending sales). The trend persisted through 2022 (-3,698; 14,437 new listings, 18,135 pending sales) and softened in 2023 (-887; 14,528 new listings, 15,415 pending sales).
Market Cycles: Recent Supply Recovery
In 2024 and 2025, the January–April market shifted back toward supply. In 2024, 17,596 new listings exceeded 16,140 pending sales, producing a difference of 1,456. Preliminary 2025 data shows 19,108 new listings and 14,778 pending sales, with a difference of 4,330, signaling a significant increase in inventory. This suggests a potential easing of competition for buyers in these months.
Multi-Year Analysis
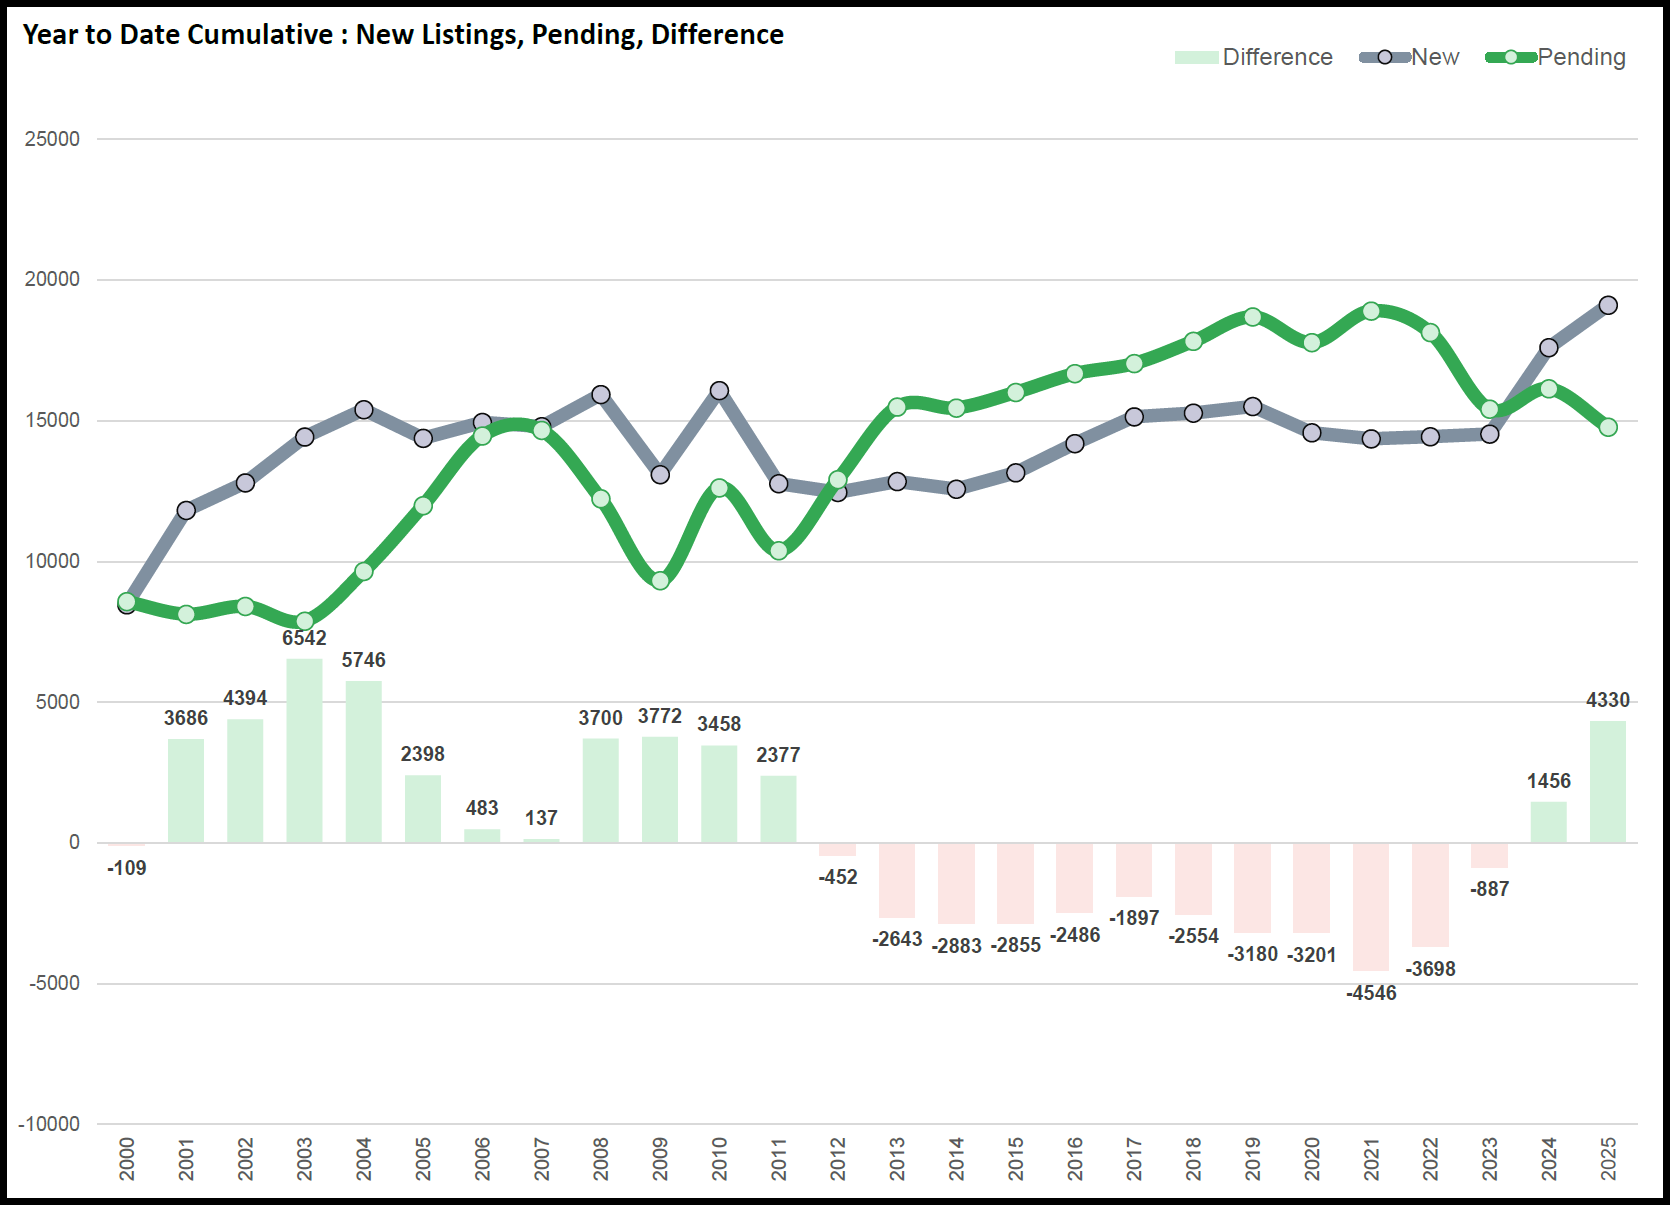
Over 25 years, Austin’s January–April data reveals distinct cycles. The early 2000s (2001–2004) saw large positive differences, averaging 5,087, indicating a buyer’s market with ample supply. The 2010s to early 2020s (2012–2022) averaged negative differences of -2,863, reflecting a seller’s market driven by high demand. Recent years (2024–2025) show positive differences averaging 2,893, suggesting a return to buyer-friendly conditions. The image below illustrates these shifts, with peaks in 2004 (5,746) and 2025 (4,330) and troughs in 2021 (-4,546).
Identifying Market Opportunities
Buyer’s Market (Positive Differences): Years like 2003 (6,542), 2004 (5,746), and 2025 (4,330) offered buyer opportunities due to high inventory, likely leading to more negotiating power and stable prices. Seller’s Market (Negative Differences): Periods like 2012 to 2022, especially 2021 (-4,546), favored sellers, with pending sales outpacing listings, driving competition and price increases. Neutral Market (Near-Zero Differences): Years like 2006 (483), 2007 (137), and 2023 (-887) showed balanced conditions, where neither buyers nor sellers had a clear advantage, fostering stable transactions.
This cumulative January–April data provides a clear lens into Austin’s real estate trends, helping stakeholders navigate its cycles. The image below, sourced from the provided data, visually captures these trends, reinforcing the market’s historical and current dynamics.
Austin Real Estate Trends: January–April New Listings, Pending Sales, and Differences (2000–2025)
FAQ Section
What do new listings and pending sales indicate in Austin’s real estate market?
New listings represent properties added to the market for sale, while pending sales are properties under contract but not yet sold. Their difference shows whether supply (positive) or demand (negative) dominates in January–April, guiding buyer and seller strategies.
How have Austin’s January–April real estate trends changed from 2000 to 2025?
From 2000 to 2009, high new listings created buyer’s markets, peaking in 2003 (6,542 difference). From 2012 to 2022, strong demand led to seller’s markets, peaking in 2021 (-4,546). In 2024–2025, supply rose, with 2025 showing a 4,330 difference, favoring buyers.
What is a buyer’s market versus a seller’s market in Austin?
A buyer’s market occurs when new listings exceed pending sales (e.g., 2004, 5,746 difference), offering more choices and bargaining power. A seller’s market, when pending sales outpace listings (e.g., 2021, -4,546), increases competition and prices, favoring sellers.